
Since 28 September Home Assistant has been controlling my home battery, and since early October also the hot water of the heat pump. Time for the first results of my Home Assistant energy system, in charts. Not to celebrate – ten days is too short for that – but to see whether the system does what I think it does.
I read the figures below from my dashboards on 8 October at around 10:00. They are for one home, in a mild week in October.
1. The heat pump has calmed down
On 2 and 3 October the compressor started around 30 times a day. That was still with the factory heating curve 50/40. Since 4 October it’s one or two starts a day, and those are mostly hot water runs.
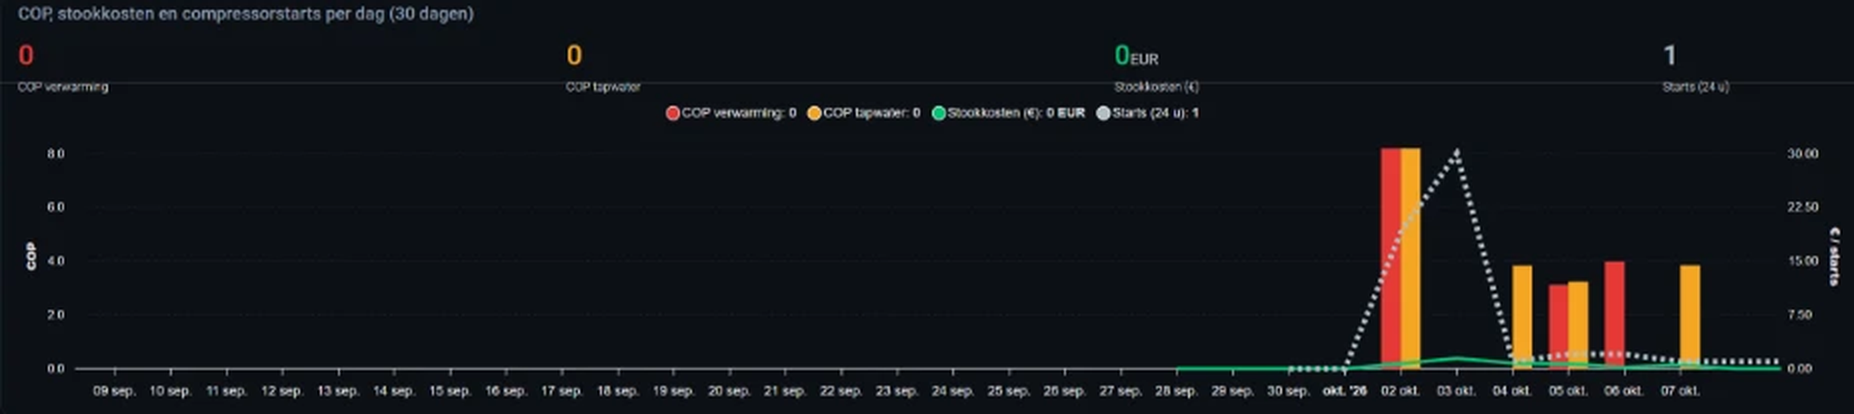
To be fair: the weather is helping. Outside it was around 13 °C and inside it stayed at about 22.5 °C, well above my comfort target of 20 °C. So the heating was hardly needed. How much of the calm comes from the new heating curve and how much from the mild weather, I can’t separate yet. I’ll only see that when it gets colder.
Since 3 October the COP looks realistic: around 3 to 4, both for hot water and for the few times the heating ran. I ignore the bars of 2 October: back then the current clamps were on the wrong phase.
2. Hot water at the cheapest hour
On 7 October EMHASS scheduled the hot water block between 13:00 and 13:45, at a price of about €0.31/kWh. Around 18:00–19:00 the price rose to about €0.45/kWh. The heat pump ran exactly in the block, at about 2.9 kW, and the tank reached about 47 °C.
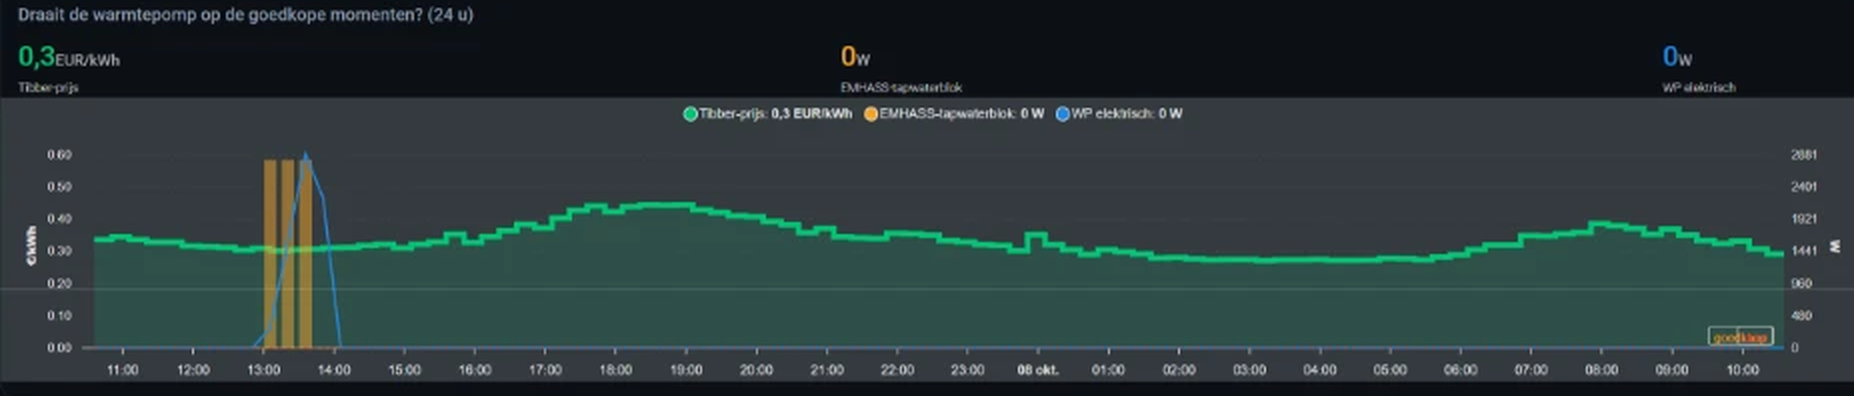
This is exactly why hot water is a deferrable load: the tank is a buffer, and EMHASS picks the hour. Since the payload also sends the remaining hours, the block no longer drifts through the day.
3. The battery follows the plan
The pattern is the same every day: charging on solar during the day, discharging during the expensive hours in the evening, and resting at the 20 % floor at night. Planned and actual power are close together. How EMHASS gets the plan to the Deye inverter is explained on EMHASS and Deye: controlling the home battery.
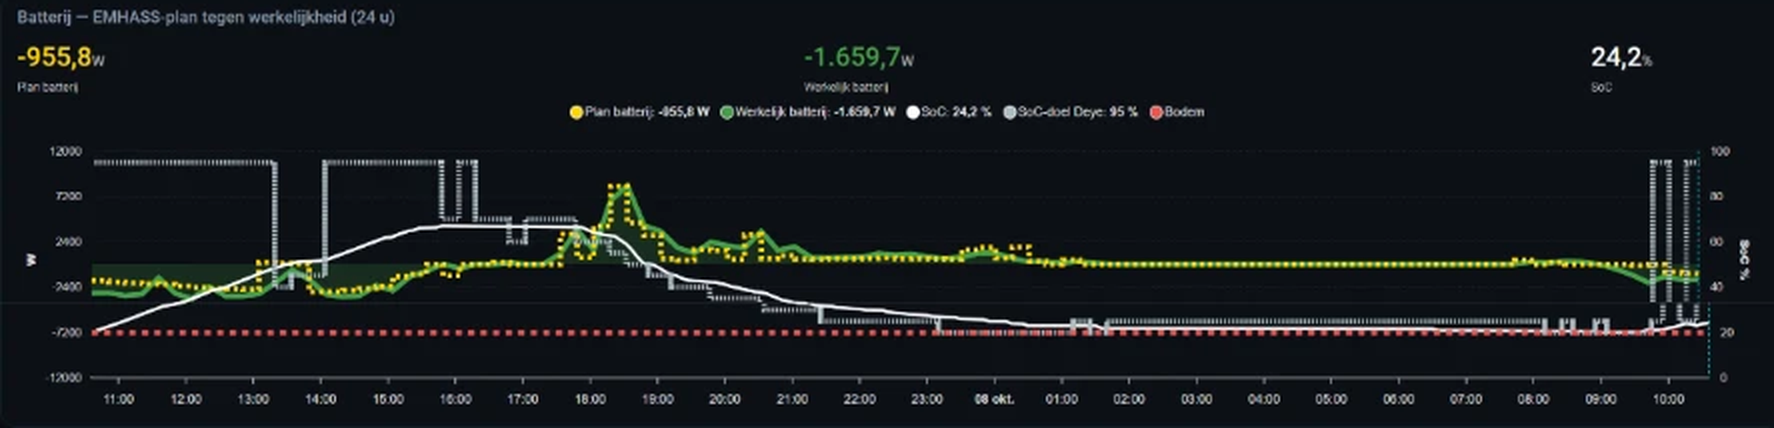
Where they differ, it’s usually because the battery charges more than planned. At the moment of the screenshot EMHASS planned about 1 kW of charging, and the battery was charging at 1.7 kW. That’s not a fault: the Deye always puts solar surplus into the battery first, even if the plan says otherwise.
The grid connection is having an easy time: per phase the grid power stayed around 0.3 kW, against a limit of 5.75 kW per phase.
4. The sun does better than forecast
On a sunny 7 October the actual yield peaked at about 4.4 kW, while the forecast stayed around 3.3 kW. The base load of the house, on the other hand, was close to what was expected.
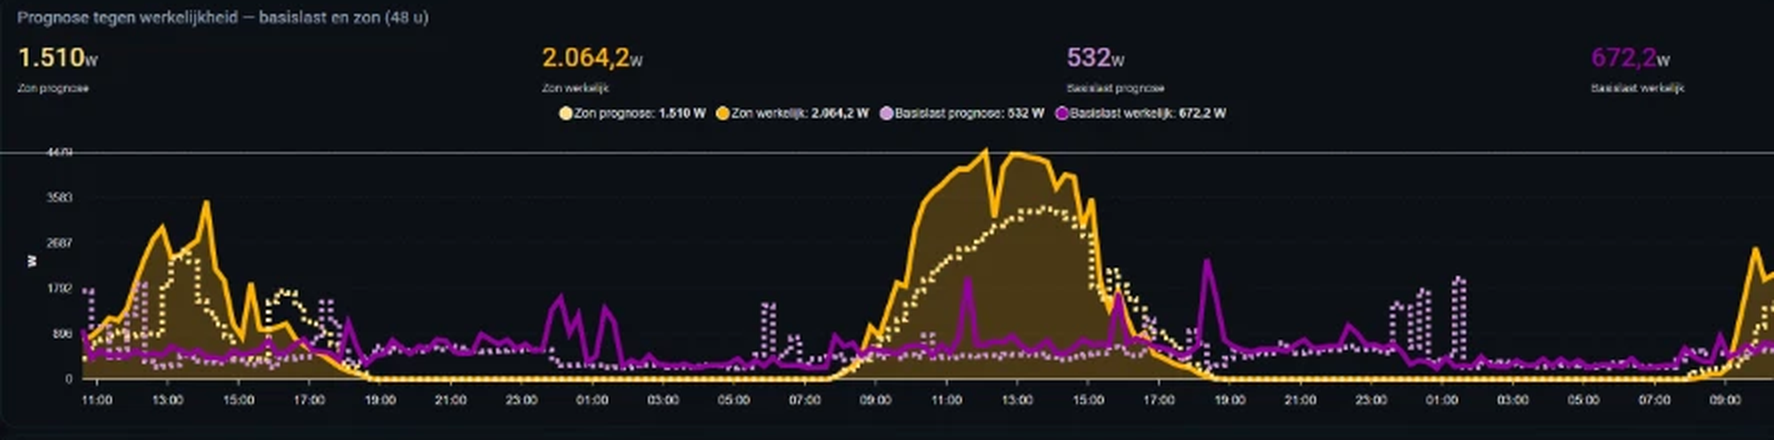
A forecast that is structurally too low makes EMHASS plan too cautiously: it counts on less sun and so keeps less room free in the battery. That’s why there is a measurement loop that suggests a new efficiency factor for the solar forecast after seven days. I’ll look at it this week.
Update 10 October: the advice is in. On clear days the forecast was 26 % too low, but the deviation varies strongly by season. How I now correct it per month, you can read in Logbook: my solar forecast was 26 % too low.
5. And the money? No conclusion yet
Every day I calculate what the electricity would have cost without a battery, and what I actually paid. The picture after ten days is mixed. In the first days the battery cost me a little, when the settings weren’t right yet. Since 1 October the actual bill is usually slightly below the one without a battery, with small differences per day.
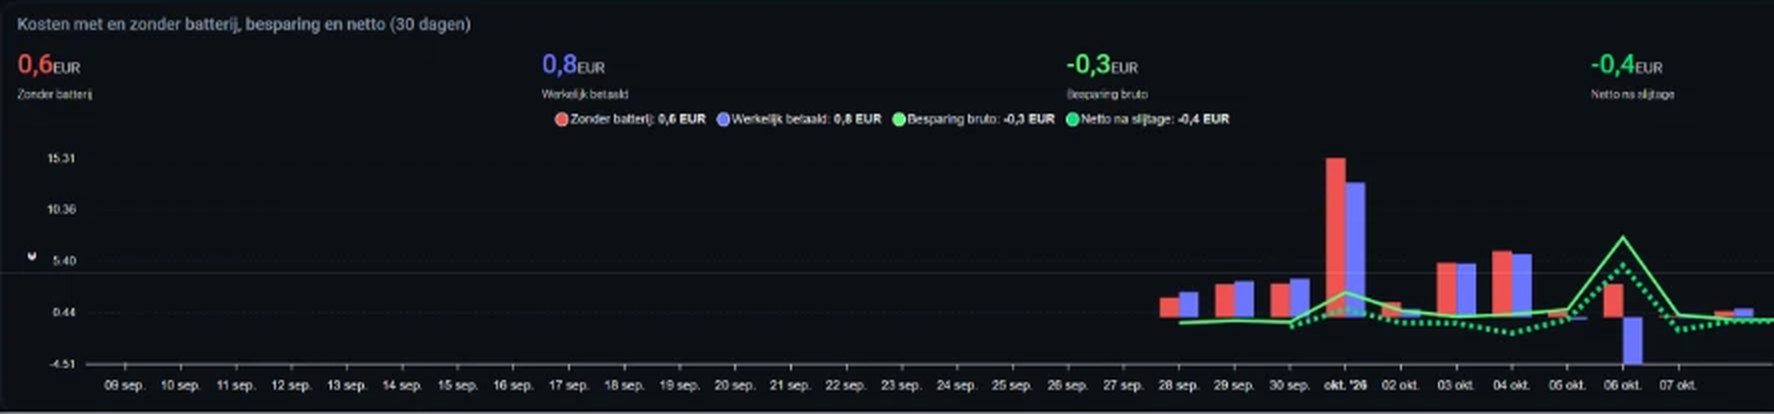
One day stands out: on 6 October the difference was remarkably large. I’ll investigate that first before saying anything about it; an outlier in a measurement is a measurement error just as often as a real result. And I also calculate the savings after battery wear, because a charge cycle isn’t free.
In short: after ten days I can’t say what it yields. After a full month, and more honestly after a winter, I can.
What I don’t know yet
- The heat loss of the house. That requires heating days, and because of the mild weather there were hardly any.
- How quickly the house cools down. The per-night measurement needs seven valid nights.
- The SCOP. That only means something after a heating season.
Next steps for my Home Assistant energy system
- Adjust the efficiency factor of the solar forecast as soon as the measurement loop gives its advice.
- Find out what happened on 6 October.
- Only let EMHASS control the heating once the building is calibrated: enough nights and heating days measured.
- Around 29 October, after a full month, update the results page (in Dutch).
What went wrong along the way is on Lessons from practice (in Dutch). How the system is put together, on How it works.
All logbooks in one place: Logbook (in Dutch).
These figures apply to one installation, in one home, in one period. They were read from dashboards and rounded; they are not a promise for any other situation.
Leave a Reply