
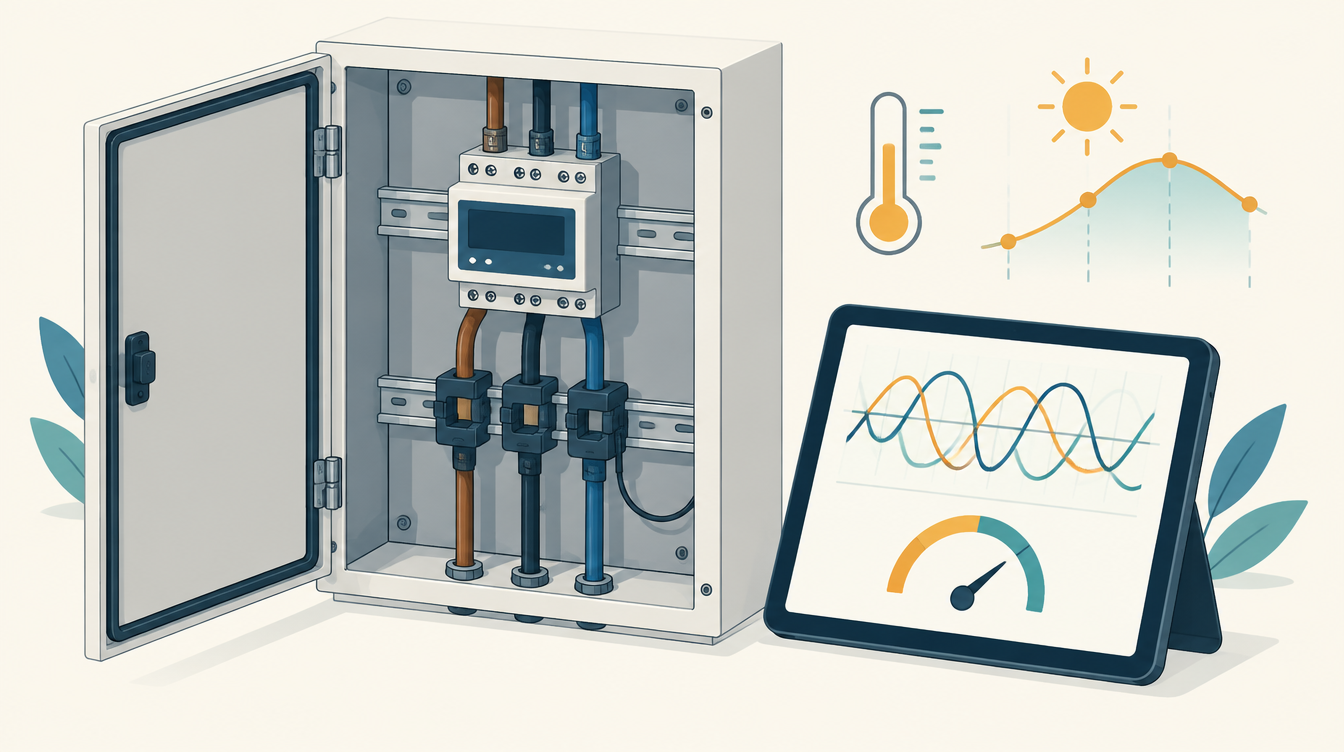
A system that runs on prices is only as good as the measurements underneath it. This page is about checking Shelly Pro 3EM current clamps and phases, calculating the heat pump’s COP, and four measurement loops that turn data into settings.
Checking current clamps under load
I measure the heat pump’s electrical consumption with a Shelly Pro 3EM with three current clamps on the outdoor unit’s 3-phase circuit. In standby it showed a neat 136 W, and under load a negative power. The clamps were cyclically shifted relative to the voltage terminals: every clamp was on the wrong phase. The full story is in Shelly Pro 3EM negative power?.
Standby tells you nothing. Look at the power factor per phase (the ratio between real and apparent power) while the compressor draws at least 1 kW.
| Power factor under load | Meaning |
|---|---|
| +0.85 to +1.0 | Connected correctly |
| about −0.5 | Phases swapped |
| about −1.0 | Clamp reversed |
Never fix this by multiplying by −1 in software: with swapped phases the magnitude is wrong too. Moving clamps in a distribution board is a job for a qualified electrician.
Even after the correction, the Shelly measures around −8 W in standby with a power factor of about 0. That is measurement noise on reactive current at the bottom end of a 63 A clamp. The calculations therefore clip at 0 W.
COP and SCOP
The COP is the heat delivered divided by the electrical consumption; the SCOP is the same over a whole season. Two lessons:
- Bad measurement data sticks in counters. The COP was too high, because the negative power from the wrongly connected clamps was clipped to 0. The SCOP therefore uses season meters that can be reset with one button, not integrations that already contain the bad data.
- Count an electric heater on both sides. A heater in the tank delivers heat that does not pass the flow meter. Include it with a COP of 1, in both the consumption and the heat.
Four measurement loops that turn data into settings
Cool-down per night
How fast does the house cool down when the heating is off? I measure that between 00:00 and 05:00, only if the heating has been off since 20:00, Modbus is connected and the difference with outside is at least 5 K. Per night and not per hour, because the thermostats measure in steps of 0.5 K. The median over seven nights becomes the cooling_constant of the building model in EMHASS.
Heat loss
Every evening: the heat delivered over 24 hours, divided by 24 hours times the average temperature difference between inside and outside. After five heating days there is a usable number.
Heating curve advice
Per zone, the tenth percentile of the indoor temperature over seven days, against the comfort target. If the lowest point stays well above the target, the heating curve can go down.
Solar forecast versus reality
Per day, the actual solar yield divided by the forecast. After seven days there is advice for the efficiency factor in the Open-Meteo forecast.
Each measurement loop keeps a diary with one value per date, so that a Home Assistant restart never counts a day twice.
What I would do differently
- Check the clamps under load before a single COP counter runs.
- Season meters with a reset button from day one.
- Only compare two values if they are from the same moment. A lagging derivative next to a later snapshot led to a wrong conclusion.
The incidents behind these lessons are on Lessons from practice (in Dutch for now).
This page contains an affiliate link. As an Amazon Associate I earn from qualifying purchases. The price stays the same for you.
These values apply to one installation. Check them against your own documentation; leave work on 230/400 V to a qualified electrician. Status: October 2026.