
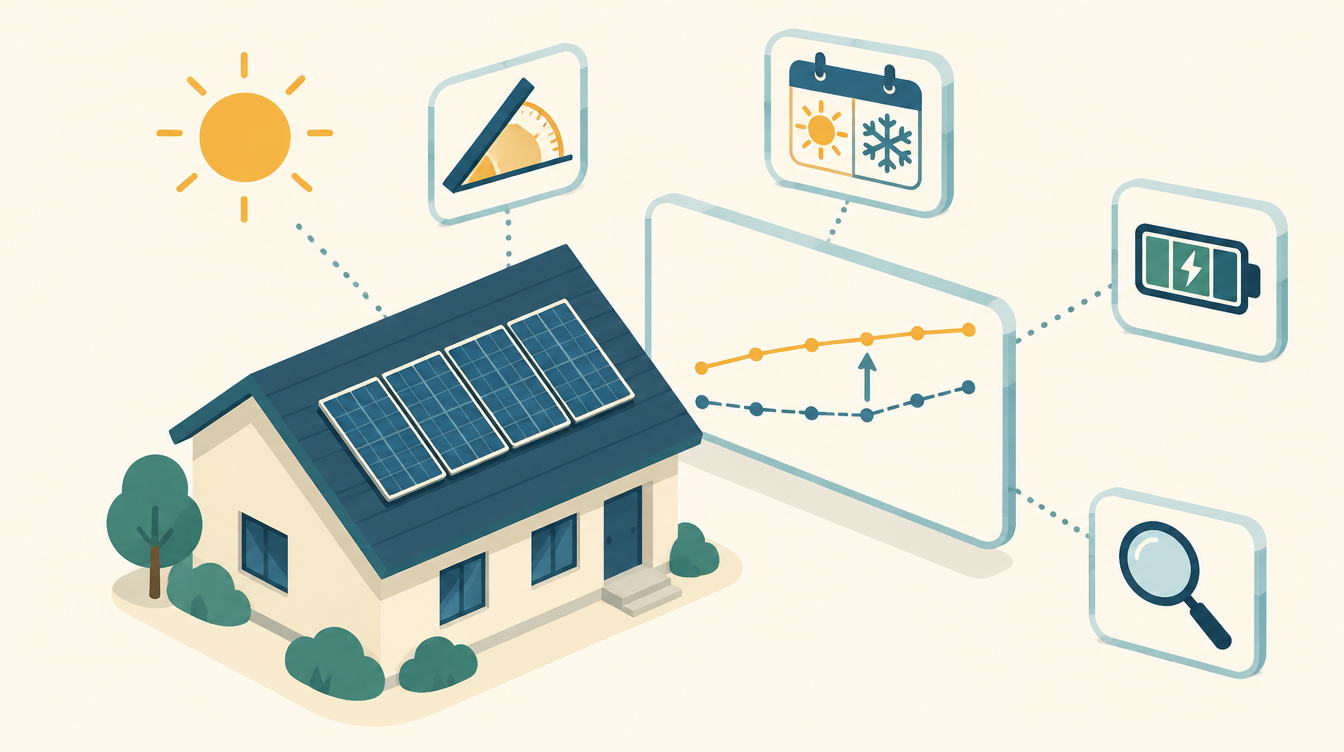
Logbook, 10 October 2026. The solar forecast that EMHASS uses to plan my home battery was structurally too low. In this logbook: how I measured that, what an external source said about it, why you can’t go about correcting a solar forecast with a single factor, and how the correction now sits in the planning per month.
Why this matters
EMHASS plans every fifteen minutes what the home battery will do: charge from the sun, top up from the grid in cheap hours, or discharge at the evening peak. To do that, it needs to know how much sun is coming in the next few hours.
- A forecast that is too low is expensive. EMHASS tops up from the grid unnecessarily, and the surplus that does arrive goes to the grid at the feed-in rate.
- A forecast that is too high is worse. Then the battery runs empty in the evening in the expectation that the sun will fill it tomorrow, and that sun doesn’t come.
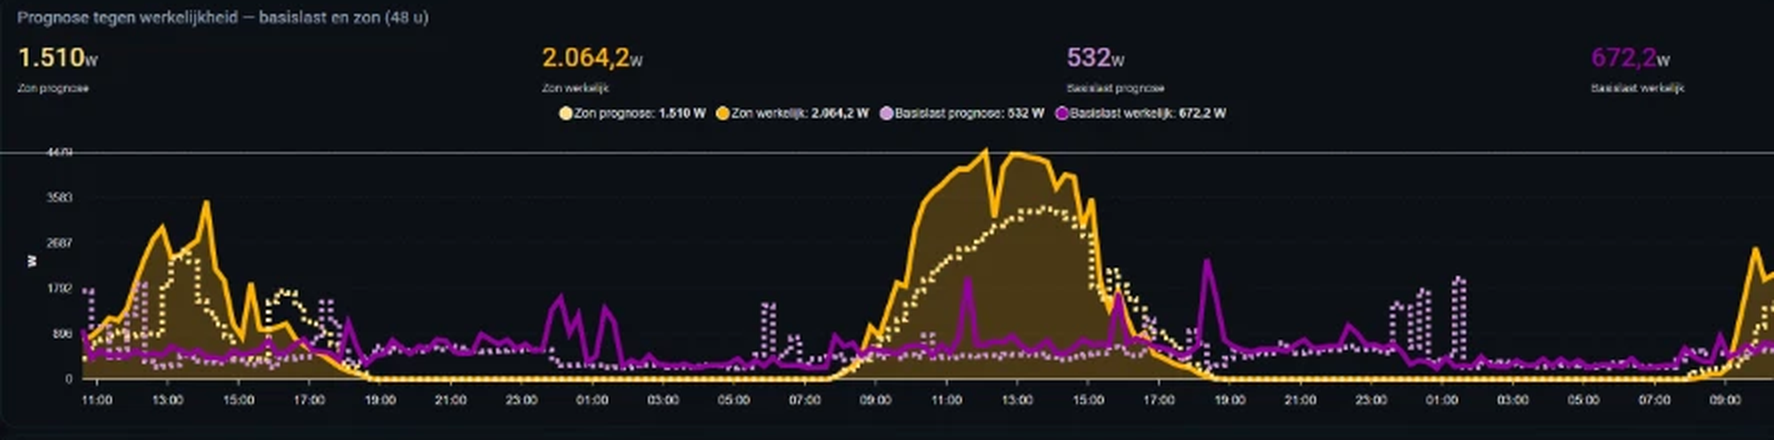
What I used
- Open-Meteo Solar Forecast in Home Assistant, with the roof details: 18 panels of 295 Wp (5.31 kWp), azimuth 205°, tilt 30°, and micro-inverters that together deliver at most 4.32 kW AC. This forecast goes to EMHASS as a list of quarter-hour values.
- My own measurement loop that divides the actual yield per day, measured by the inverter, by the forecast yield, and gives a median after seven days. How it works is explained on Measuring and calibrating.
- An external reference: the electricity analysis from jeroen.nl. Using twelve months of your own generation, it calculates per month how far off the standard forecast is. Free, based on your own data.
Why I compare two sources
One measurement is a number. Two measurements that measure something different also tell you why that number is what it is. My measurement loop is precise, but short: seven days, from one week of weather. The jeroen.nl analysis is coarser, but long: twelve months, with every season and every grey day in it. If they arrive at the same result, I trust it. If they differ, the difference itself is the information.
What the measurements said
| Source | Period | Actual vs. forecast |
|---|---|---|
| Own measurement loop | 7 days, 3–9 October | +26 % (median) |
| jeroen.nl | October, from 12 months | +14 % |
| jeroen.nl | March–June, August–September | +22 to +28 % |
| jeroen.nl | January–February | +3 to +5 % |
| jeroen.nl | December | −10 % |
The two sources don’t contradict each other; they measure something different. My seven days were mostly clear, and on clear days the weather model underestimates irradiance the most. The jeroen.nl analysis looks at whole months, grey days included. For a correction that has to apply for a month, that second value is the better one.
Why one factor doesn’t work
My first instinct was an average: over twelve months that comes to +16 %, energy-weighted even +22 %. But the pattern is strongly seasonal. With a single factor of +16 %, the forecast would be almost 30 % too high in December, and well over 10 % too low in April.
And in winter in particular, that’s the wrong direction. A forecast that is too high lets the battery run down unnecessarily in the evening, exactly in the months when the sun can refill it the least the next day.
What I changed: correcting the solar forecast per month
A correction table per month, not in the weather integration but in the payload that Home Assistant sends to EMHASS. Every fifteen minutes the forecast is multiplied by the factor for the current month:
| Month | Factor | Month | Factor |
|---|---|---|---|
| January | 1.05 | July | 1.19 |
| February | 1.03 | August | 1.22 |
| March | 1.22 | September | 1.27 |
| April | 1.28 | October | 1.14 |
| May | 1.27 | November | 1.08 |
| June | 1.26 | December | 0.90 |
- A ceiling of 4.32 kW still applies, even after the correction. The micro-inverters can’t deliver more, so a forecast above that is wrong by definition.
- A fine-tuning control (default 1.00) on top of the table, in case the measurement loop does show a structural deviation in a few weeks.
- The weather integration stays on the real roof details: 5.31 kWp and the default factor 0.92. The correction sits in one place, and the measurement loop keeps testing the uncorrected forecast. So in October it should keep reporting around +14 %. That is no longer advice, but a check that the table is right.
The core of the correction, as it sits in the payload:
pv_maand = {1: 1.05, 2: 1.03, 3: 1.22, 4: 1.28, 5: 1.27, 6: 1.26,
            7: 1.19, 8: 1.22, 9: 1.27, 10: 1.14, 11: 1.08, 12: 0.90}
factor    = pv_maand[maand] * extra_correctie
prognose  = min(open_meteo_kwartierwaarde * factor, 4320)
The 4320 is the ceiling in watts. How the rest of the payload is put together is explained in EMHASS and the battery.
In evcc the azimuth turned out to be wrong. evcc, which plans the car charging, uses the same Open-Meteo forecast. There Open-Meteo works with 0 = south, not with a compass bearing. So 205° on the compass is 25 there.
What I’m still looking into
- The roof tilt. My configuration says 30°, the jeroen.nl analysis says 45°. That may be a default value: jeroen.nl also uses 45° in his own research into generation per location. In winter that difference isn’t harmless: a steeper roof catches more low sun, and part of the seasonal pattern would fit that. I’ll measure the tilt before I change anything.
- Recalculating the table from my own data after a year, once the measurement loop has twelve months. Then the external reference is no longer needed.
The lesson
Measure first, correct afterwards, and don’t correct more than your measurements justify. Seven clear days are not a month, and an annual average is not a season. When two sources differ, the question isn’t who is right, but what exactly they measure.
Why a 36-hour horizon no longer lets the battery run empty in the evening, you can read in The EMHASS horizon.
All logbooks in one place: Logbook (in Dutch). All incidents and lessons: Lessons from practice (in Dutch).
This works in my situation: one roof facing south-west, one week of my own measurement data and the jeroen.nl analysis over twelve months. Correction factors apply to one installation. Check it against your own documentation and your own measurements. As of October 2026.
Leave a Reply